Untangle PostgreSQL Grafana Dashboards
Untangle PostgreSQL Grafana Dashboards
Why
I just installed an Untangle firewall appliance in my home network. I like it a lot. Great functionality, easy to use, great reports, very low resource usage. As a typical Grafana user, I needed to GRAPH ALL THE THINGS! Untangle is open source and even uses a standard PostgreSQL database. Grafana supports PostgreSQL, so connecting the two should be easy. Well, nothing is ever easy is it? 🙂
How
Parts List
Open Up Untangle Firewall to Allow Internal PostgreSQL Access
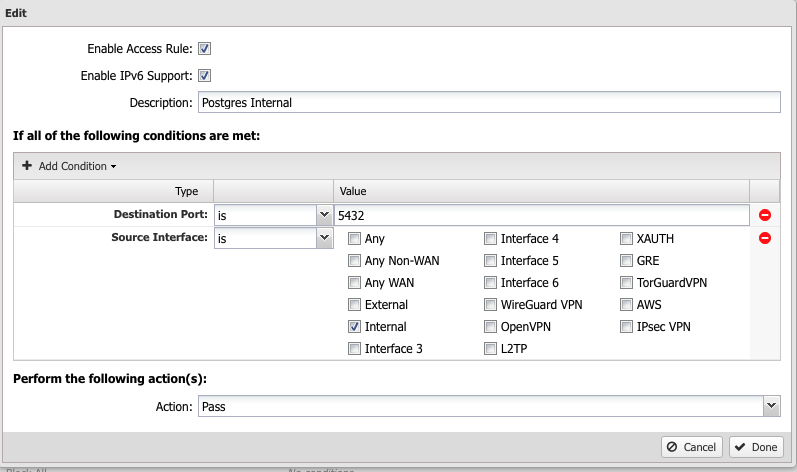
Untangle, being an exellent security appliance, is locked down tight. The only access to the appliance are very tightly controlled SSH, HTTPS, RADIUS, DNS, DHCP and a few other internal-only ports. We want to allow access to the PostgreSQL port (5432) from the internal network (Grafana).
In the Untangle web interface go to Config > Network > Advanced > Access Rules. Add this rule:
Move the rule up to the top and click Save.
Open Up Untangle PostgreSQL Database to Other Hosts
My Grafana server is separate from my Untangle appliance naturally. Although I could access PostgreSQL by ssh-ing into the Untangle appliance and typing “psql -U postgres”, typing “psql -U postgres -h untangle” got me nowhere. After some research, I learned that PostgreSQL is only acessible by localhost by default. Smart. One needs to edit two PostgreSQL files to allow access from other hosts – postgresql.conf and pg_hba.conf. In postgresql.conf change ‘localhost’ to ‘*’ and in pg_bha_conf add the a line that points to your internal network like “host all all 192.168.1.0/24 trust”. I found this guide helpful.
/etc/postgresql/11/main/postgresql.conf
#listen_addresses = 'localhost'         # what IP address(es) to listen on;
listen_addresses = '*'                  # what IP address(es) to listen on;
                                        # comma-separated list of addresses;
                                        # defaults to 'localhost'; use '*' for all
                                        # (change requires restart)

/etc/postgresql/11/main/pg_hba.conf
# IPv4 local connections:
host    all             all             127.0.0.1/32            trust
host    all             all             192.168.1.0/24            trust
After editing these two files run the command
systemctl restart postgresql
to enable your changes. Now running the command
psql -U postgres -h untangle
should work (as long as you use the correct hostname/IP address after -h).
Add Untangle PostgreSQL as a Grafana Data Source
From the Grafana web interface, choose Configuration > Data Sources > Add Data Source > PostgreSQL Give your data source a name, type the IP address of your host and :5432 in the Host field, type uvm for the Database, postgres for the User and select your PostgreSQL version from the Version drop down then click Save & Test. If you are unsure of the version, you can type this command into psql:
uvm=# select version();
                                                     version
------------------------------------------------------------------------------------------------------------------
 PostgreSQL 11.11 (Debian 11.11-0+deb10u1) on x86_64-pc-linux-gnu, compiled by gcc (Debian 8.3.0-6) 8.3.0, 64-bit
(1 row)
Add a Grafana Panel for Untangle PostgreSQL
So, even though Grafana happily connected to the PostgreSQL on the Untangle appliance, I could not get any tables to show up in my Grafana panels. (I have a feeling that Grafana does not like PostgreSQL schemas which Untangle uses heavily. You can find the full Untangle PostgreSQL schema/table layout here). Through failing, and failing, and failing, and succeeding, I learned that I needed to manually enter the schema.tablename into the From field of the new Grafana Panel. Once I did that, all the other fields became populated. In the example above, I wanted to graph intrusion_prevention_events, so I typed reports.intrusion_prevention_events. reports is the schema in this case.
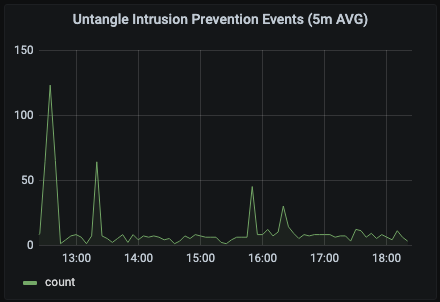
My initial goal was to duplicate the table of blocked intrusion prevention events from the Untangle dashboard. Unfortunately, Grafana picked up the MSG field as a metric to be filtered on and did not pick up source_ip and destination_ip at all. I’m sure if I had more experience with Grafana <> PostgreSQL I might be able to fix that, but I moved on. I decided to create a line graph of number of events rather than a table of events. If the graph spiked in Grafana, I could drill down in the Untangle interface for specifics. I eventually landed on graphing a count of events over 5 minute intervals.
My next problem to solve was that my graph time on the X axis was 4 hours behind. Very odd as my Grafana Server, my Untangle Appliance, and my laptop are all set to the same time and time zone. Who knows? After a little Googling, I learned that I could shift time in a PostgreSQL statement with “time_stamp + interval ‘4’ hour”. I added this format to the SELECT and the WHERE and Bob’s Your Uncle, the graph lined up with reality. I’m open to suggestions as to why this might have happened.
Thank You
Well, that’s about it. Open up your PostgreSQL database to other hosts, add as a Grafana source, and type in the name of the table preceded by the schema name. Thank you for taking the time to read this post. I hope you found the post helpful and/or informative. I welcome your feedback.


