Monitoring Plex in VMware vRealize Log Insight


Monitoring Plex in VMware vRealize Log Insight

Why

This week, I have been migrating from a nice FOSS logging solution (GrayLog) that became corrupted (my fault) back to the lovely, solid, and easy to use VMware vRealize Log Insight (Now called VMware Aria Operations for Logs). Part of this process has been adding custom rsyslog config files to ingest messages that do not live in /var/log. I added log definitions for the containers sabnzbd, overseerr, radarr, sonarr, tautulli, and varken to keep track of errors. For Plex, beyond tracking errors, I thought I would also create some fun graphs to keep track of how Plex is being used. (Yes, vRealize/Aria Operations is actually the _correct_ way to do this, but I was reinstalling Log Insight so I gave that a whirl)
NB: Like many of you, the media on my Plex Server is strictly from the Public Domain. Titles such as Big Buck Bunny, Quadrophenia, and Nosferatu 🙂.
Also, NB: The free Tautulli software creates all the Plex graphs you could ever want easily. You can find Tautulli here.
What

Inventory for this use case is:
- vRealize Log Insight (Did you know that Log Insight Cloud is free for up to 5GB of log data?)
- Linux, including built-in rsyslog
- Plex Media Server
- vRealize Log Insight (Did you know that Log Insight Cloud is free for up to 5GB of log data?)
- Linux, including built-in rsyslog
- Plex Media Server
How

Add Plex Log to Rsyslog
Log files that are not located in /var/log need to be defined through config files in the directory /etc/rsyslog.d. I created the file named 30-plex.conf in that directory:
dennis@plex:/etc/rsyslog.d$ cat 30-addons.conf module(load="imfile" PollingInterval="10") # plexmediaserver input(type="imfile" File="/var/lib/plexmediaserver/Library/Application Support/Plex Media Server/Logs/Plex Media Server.log" Tag="plexlog")The Tag=”plexlog” is important as this will be used to filter all Log Insight messages for just Plex messages.Add LogInsight as a log destination to Rsyslog
One of the features of Log Insight that I love is that it can act as a regular syslog destination. Some other central log systems require that you install agents or convert your logs to JSON first. With Log Insight, just point rsyslog to Log Insight and voila!Adding Log Insight as a destination for rsyslog is nothing more than adding one line to the end of /etc/rsyslog.conf and restarting rsyslog. Replace @loginsight below with the name or IP address of your Log Insight server (or Log Insight Cloud Proxy).dennis@plex:~$ vi /etc/rsyslog.conf # # Include all config files in /etc/rsyslog.d/ # $IncludeConfig /etc/rsyslog.d/*.conf # Send log messages to LogInsight *.* @loginsight:514 dennis@plex:~$ sudo systemctl restart rsyslog dennis@plex:~$ sudo systemctl status rsyslog ● rsyslog.service - System Logging Service Loaded: loaded (/lib/systemd/system/rsyslog.service; enabled; vendor preset: enabled) Active: active (running) since Fri 2023-03-10 16:33:25 EST; 6s ago TriggeredBy: ● syslog.socket Docs: man:rsyslogd(8) man:rsyslog.conf(5) https://www.rsyslog.com/doc/ Main PID: 429632 (rsyslogd) Tasks: 5 (limit: 19063) Memory: 1.5M CPU: 6ms CGroup: /system.slice/rsyslog.service └─429632 /usr/sbin/rsyslogd -n -iNONE Mar 10 16:33:25 plex systemd[1]: Starting System Logging Service... Mar 10 16:33:25 plex rsyslogd[429632]: imuxsock: Acquired UNIX socket '/run/systemd/journal/syslog' (fd 3) from systemd. [v8.2112.0] Mar 10 16:33:25 plex rsyslogd[429632]: rsyslogd's groupid changed to 111 Mar 10 16:33:25 plex systemd[1]: Started System Logging Service. Mar 10 16:33:25 plex rsyslogd[429632]: rsyslogd's userid changed to 104 Mar 10 16:33:25 plex rsyslogd[429632]: [origin software="rsyslogd" swVersion="8.2112.0" x-pid="429632" x-info="https://www.rsyslog.com"] start dennis@plex:~$Test Log Insight Integration
The easiest way to check that your new “plexlog” rsyslog messages are getting into the Log Insight database is just to search for the “plexlog” tag. Once logged into Log Insight, choose “Explore Logs”, pick a timeframe, type “plexlog” in the search field and press Enter.
Build a custom extracted field
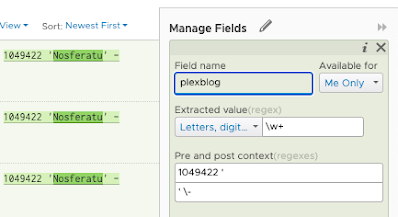
My end goal is to build a pie chart of media watched on Plex. The name of the Plex media is not a field that exists by default from the rsyslog feed. Log Insight lets you use regex to create custom fields that can be searched and graphed. Log Insight even tries to build the regex for you which is very helpful.I was recently watching Nosferatu on Plex, so I will start with a search for Nosferatu. If I click “ADD FILTER” and “text contains nosferatu” then click the search magifying glass, I will see plexlog entries for Nosferatu.In order to create a custom field that holds the name of the media being played in Plex, we start by highlighting the word “Nosferatu” and choosing “Extract field from the menu”Log Insight takes a guess at what to look for before the extracted field and what to look for after the extracted field. Close, but not perfect. Also, I gave our new extracted field a name – plexblog. Let’s modify the automatic regex to be a little more accurate as we want to remove the number 1049422 from the regex. As we make changes, the highlight will change.This regex looks a little more accurate. The original w+ matches and number of words following made up of
[A-Za-z0-9_] characters. .* matches any character following. I’ll click Update to save the change.Let’s test our new “plexblog” extracted field to see if more than Nosferatu is returned for media that has been played in the last hour. If I search for “plexblog exists” I get all the log messages that match the regex of our new extracted field plexblog. If I expand plexblog in the right pane, I can see that more than Nosferatu was played. Big Buck Bunny was also played.
Graph the Custom Field
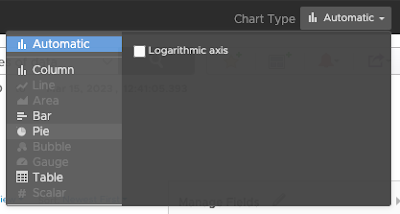
Now that we have a decent and working extracted field definition, let’s create a pie chart! We’ll start with the same “plexblog exists” query above but change the summary type and graph type. The first step is to change the “grouped by” from “Time series” to “Non-time series”. Also choose “plexblog” as the group by field.When you click “Apply” the graph will change to a bar chart graph.To change this to a pie chart, click “Automatic” on the right and choose “Pie”.
The chart will switch to Pie. Feel free to play with the pie chart options until you get a format you like.Place the Pie Chart on a Dashboard
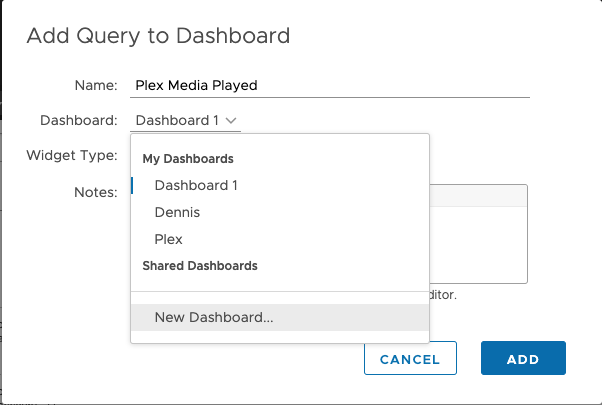
When you build queries that you like and that are repeatable, you can bookmark the query (star), add to a dashboard (square), create an alert (bell) and/or share (arrow) the query.To add our new pie chart to a new dashboard named “Plex Blog”, click the dashboard icon give your dashboard chart a name, an either add to an existing dashboard or create a New Dashboard… We’ll create a new dashboard.Name your new dashboard and click Save and then click Add to add the chart to the dashboard.
Navigating to the Log Insight menu, choose Dashboards, Plex Blog, and we will see the chart we just created on the dashboard we just created.Thank You


I hope you have found this post informative and maybe even entertaining. Thanks for taking the time to read. I welcome your feedback and improvements.